

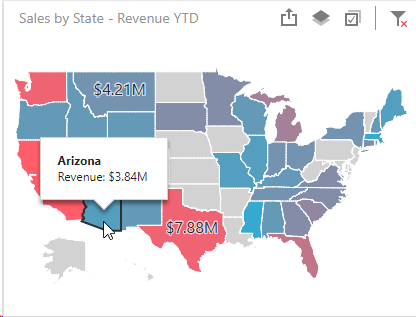
Choropleth Map in Dashboard
The Choropleth Map is a powerful visualization tool used to display geographical data by shading regions based on numeric values.
It’s ideal for showing distribution, intensity, or performance across different areas like countries, states, or custom regions.
More information can be found on the website of DevExpress (external link Choropleth Map).