The spectral analysis can be used for Maldi-TOF analysis.
-
Go to the Other Tools tab, and click on Spectral Analysis in the Modules section.

-
When you have only FDI files, then click on the button Convert FDI files to generate the MzML files.
-
Click on the button Open files and select 1 or more multiple MzML or MsXml files.
-
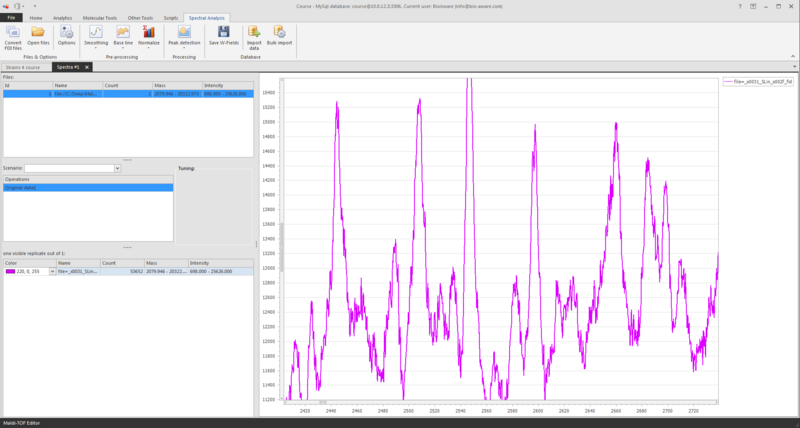
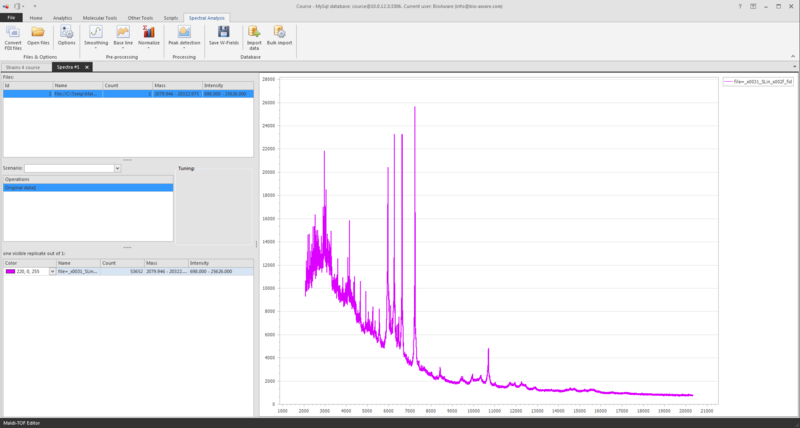
At the top left you see the file(s) loaded.
-
At the middle left you see the operations, for now the original data is displayed.
-
At the bottom left you see the information of the shown graph/spectrum.
To zoom the graph, press the Ctrl- key and use the scroll on your mouse (scroll up to zoom in, and scroll down to zoom out).
Another way to zoom in is to press the Shift-key and to select an area in the grid with your mouse. Press Ctrl-A on the graph to see the full graph again.
Once the file is loaded there are a number of (pre-) processing steps to be performed:
- Smoothing: Remove background noise by smoothing the current data.
- Base line: Filter any sensor offset by removing a base line to the current spectra.
- Normalize: Normalize the spectra by dividing by a calculated denominator.
- Peak detection: Detect peaks automatically and generate a new spectrum.
The options can be used to set the parameters.
In the end the data can be imported into the BioloMICS database.
This movie shows how to use the spectral analysis tool in BioloMICS.
1. Wave field (W / WLink) (0:10)
2. Open Spectral analysis (0:20)
3. Open files (0:27)
4. Smoothing (0:59)
5. Options (1:19)
6. Base line (1:29)
7. Zoom in and out (1:42)
8. Normalize (1:59)
9. Peak detection (2:09)
10. Save scenario (2:34)
11. Bulk import (2:52)
12. Import data (3:02)
13. Save W-Fields (4:52)
14. Clustering tree (4:58)
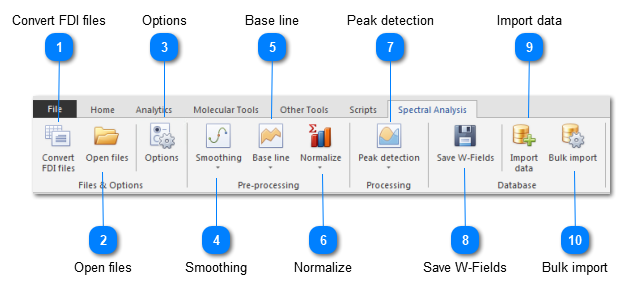
 Convert FDI filesMaldi-TOF machines may produce FDI files as exporting format. These files need to be converted to MzML files before they can be used in the Maldi-TOF analysis in BioloMICS.
|
|
 Open filesOpen 1 or multiple MzML or MsXml files to be used in the analysis.
|
|
 OptionsSet parameters for the different processing steps.
|
|
 SmoothingRemove background noise by smoothing the current data. Possible options: Custom average, Wide average, Savitsky-Golay and Gauss.
|
|
 Base lineFilter any sensor offset by removing a base line to the current spectra. Possible options: SNIP, TOP hat, Median and Convex hull.
|
|
 NormalizeNormalize the spectra by dividing by a calculated denominator. Possible options: Max value, Summ of values and Vector length.
|
|
 Peak detectionDetect peaks automatically and generates new spectrum. Possible options: Lorentz, Gauss, mApv, Parabolic and Top points.
|
|
 Save W-FieldsWhen re-opening the spectra analysis from the values in the W field and changes are made to the analysis after, then these changes can be saved in the W field (it overwrites the current data in the W field).
|
|
 Import dataImport spectrum into the BioloMICS database, either a wave (W) field or via a wave link (W-Link) field. The original source file, the detected peaks and the scenario can also be imported here.
|
|
 Bulk importBulk import MzML and MsXml files in the background, using a defined scenario.
|
|