

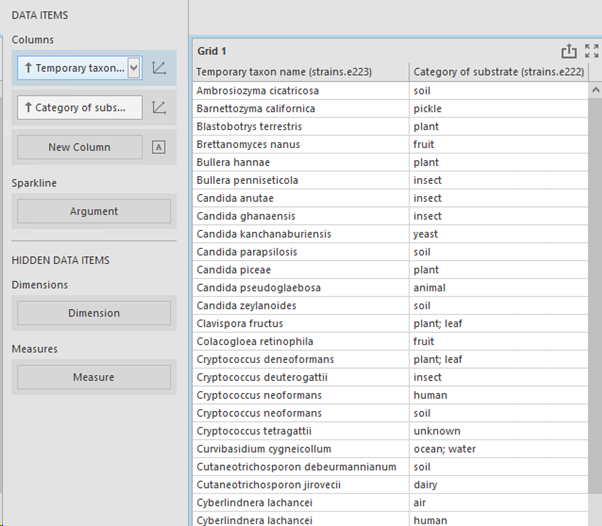
Grid in Dashboard
The grid displays data in tabular format, making it ideal for detailed data analysis and reporting
It presents data in rows and columns, similar to a spreadsheet.
More information can be found on the website of DevExpress (external link Grid).