

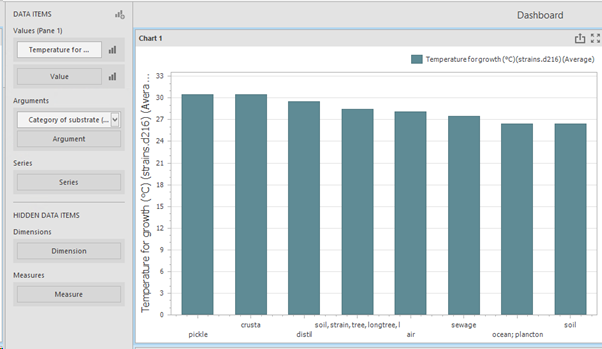
Chart in Dashboard
The Chart shows data using visuals like bars, lines, or areas.
It helps users spot trends, patterns, and compare values across different categories.
More information can be found on the website of DevExpress (external link Chart).