

Pies in Dashboard
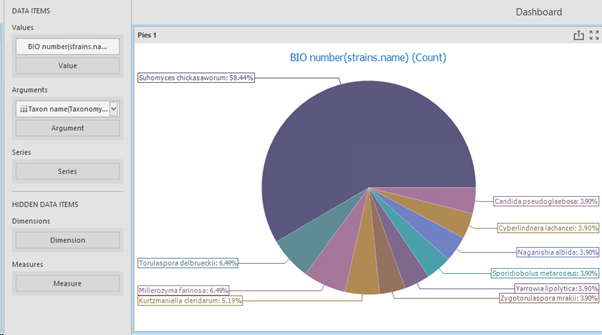
The Pies dashboard item uses pie or donut charts to show how each value makes up part of a whole.
It's great for visualizing how data is distributed or broken down into categories.
More information can be found on the website of DevExpress (external link Pies).