

Sankey in Dashboard
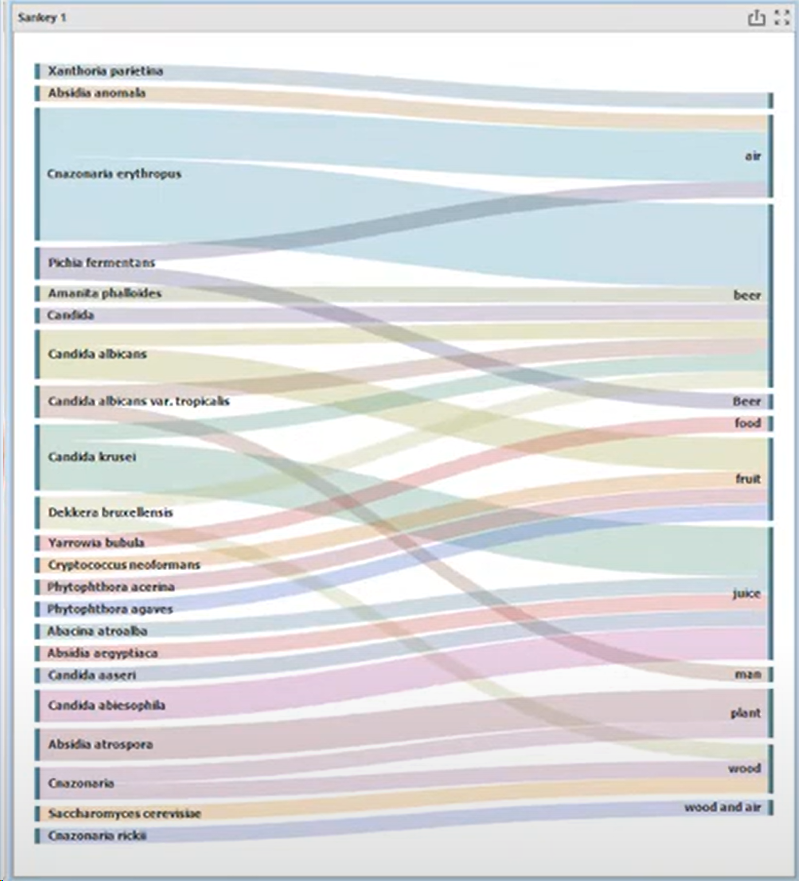
The Sankey Diagram is a specialized visualization used to depict flows and relationships between categories, where the width of each link is proportional to the flow quantity.
It’s especially useful for showing how values split and merge across stages.
Nodes represent categories or stages.
Links between nodes show the magnitude of flow from one category to another.
More information can be found on the website of DevExpress (external link Sankey).