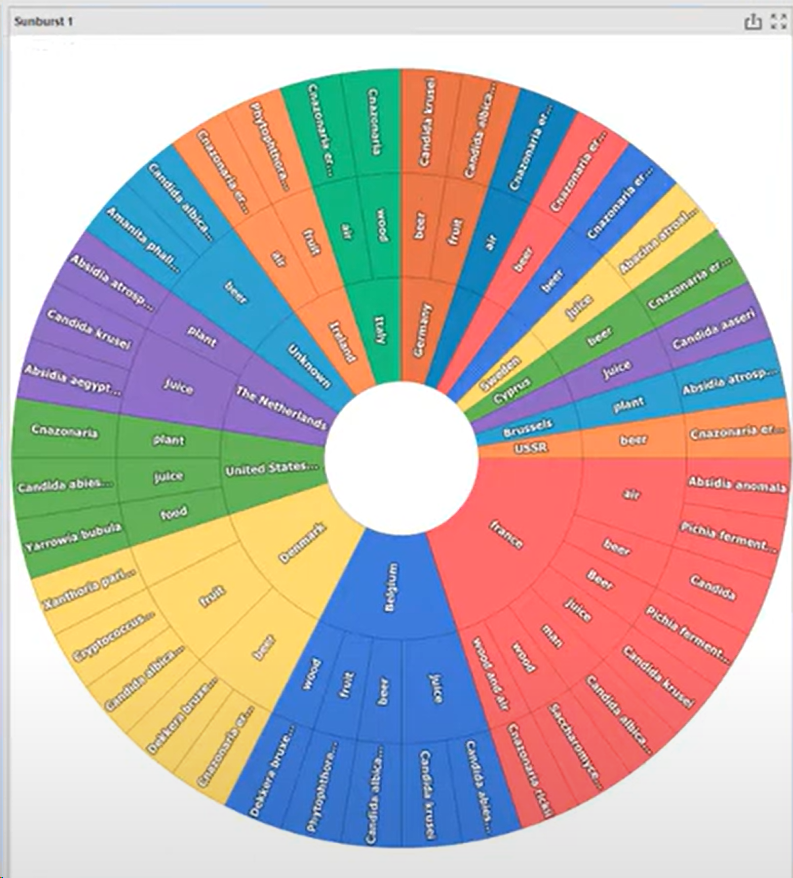
Sunburst in Dashboard
The Sunburst is a hierarchical data visualization that combines elements of a treemap and a pie chart, displaying multi-level data in a circular layout.
The innermost circle represents the top-level category.
Each concentric ring moving outward shows deeper levels of the hierarchy.

More information can be found on the website of DevExpress (external link Sunburst control).

