Geographic distribution module
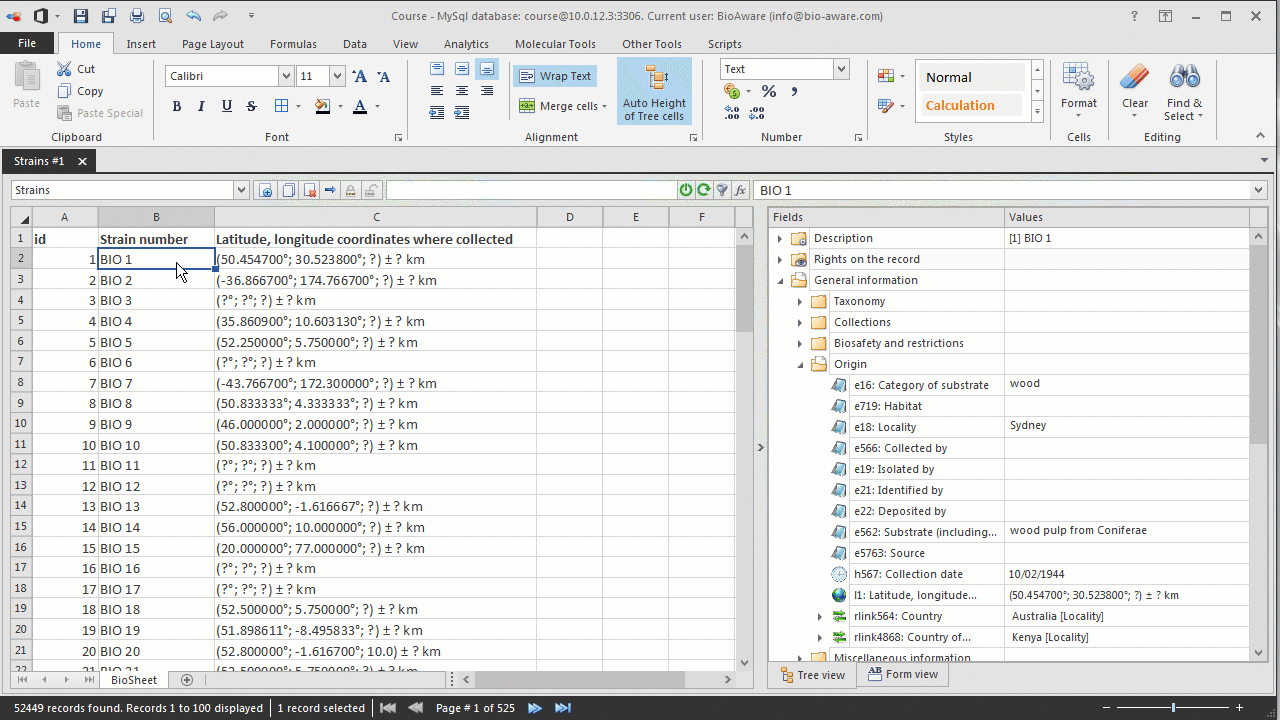
The geographic distribution module was mainly created to produce distribution maps based on latitude and longitude data.
-
Select the records that contain geographic information in latitude-longitude fields (L or LLink fields).
-
Right-click on one of the selected cells and select View on map.Choose one of the listed L and LLink fields present in the current table view.
-
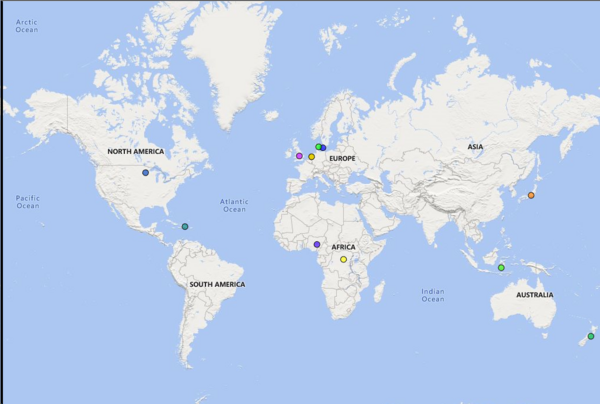
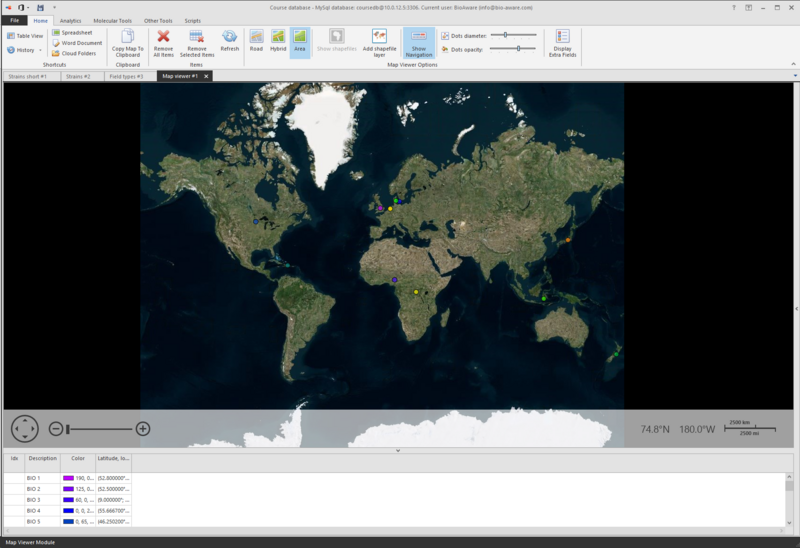
The map viewer will be opened.
-
To add more L or LLink field data to the current map, go back to the BioSheet and repeat step 1 and 2 as described above.
-
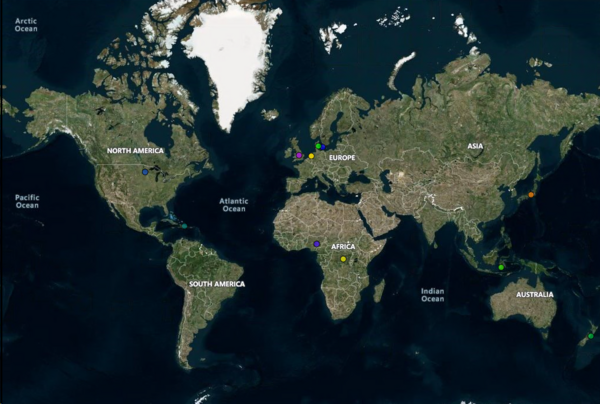
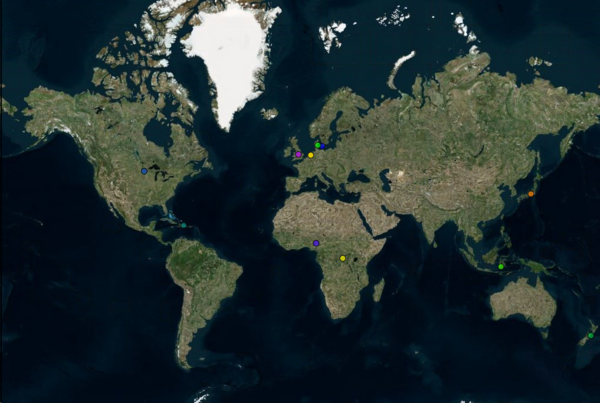
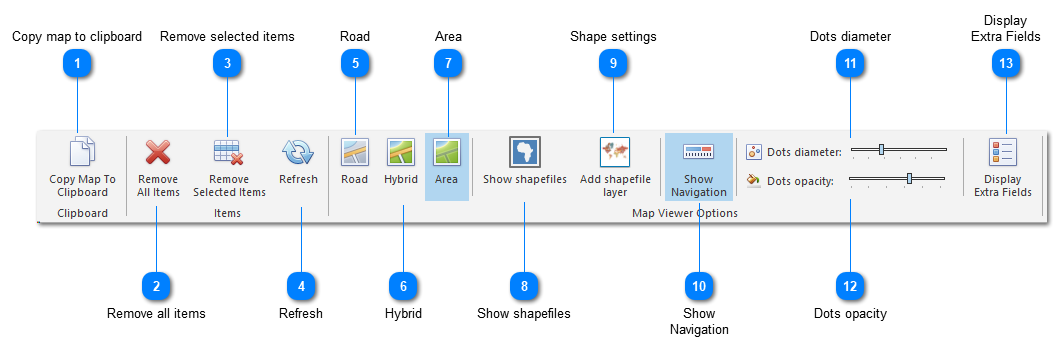
Different looks of the map are available from the ribbon: Road, Hybrid and Area. Shapefiles can also be displayed.Click Shown shapefiles (and Add shapefile layer) to show a shape file representing a specific map instead of the Microsoft Bing map.The shapefile at the top of the list is shown as highest layer on the map
-
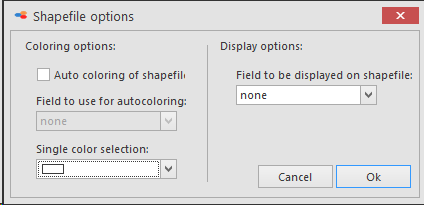
To edit the look of the shape file, double click on the shapefile in the shapefile section on the right side of the window..
-
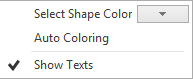
Coloring options to color the map with a given color. Select the wanted color from the color pallet, shown when clicking on the arrow button on the right of the option.
-
Auto coloring To color the shapefiles automatically.
-
Display options To show or hide the texts on the map.
-
The navigation pane can be shown or hidden using the button Show navigation.Move the dots diameter to the right to increase the size of the dots on the map. Move to the left to decrease the size.Move the dots opacity to the right to increase the opacity of the dots on the map. Move to the left to decrease the opacity.
-
Click Display extra fields to see more data of the records in the lower grid.Select the additional field(s) to be displayed from the left grid and click on the arrow button
 to add it to the selected fields list on the right.Use the other arrow buttons to remove the fields from the list
 , or move the fields up
  or down
  . Note the upper field in the list will be displayed next to the name field column, the second one on the right of that etc.Click Apply to go back to the map.
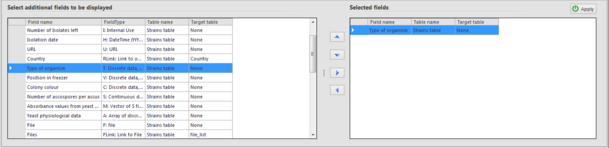
-
Click on a given dot on the map to see it's details in the lower grid.
-
To save the map to clipboard, click Copy map to clipboard.To save the map externally, click on the Save button
 on the top left of the BioloMICS window.
 -
To clear the map, select all record in the lower grid, and press the Delete key on your keyboard.
This movie shows how to use the geographic manager in BioloMICS.
1. Locality data in O and L field (0:09)
2. View latitude, longitude values on map (0:24)
3. Map display (0:39)
4. Show/Hide navigation panel (1:07)
5. Set diameter and dots opacity (1:10)
6. Display extra fields (1:26)
7. Copy map to clipboard (2:05)
8. Save the map (2:12)