

Normalize
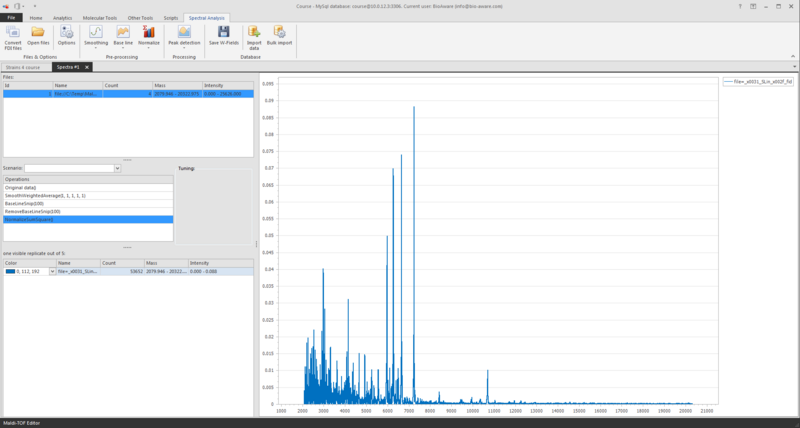
After completing the base line, we start to normalize the curves to be able to compare them easily. Because it is difficult to compare a peak that is at 3000 with another peak that is at 6000. So we will normalize the curves, which means we will divide them by a value so that they all look similar. The peaks will be rescaled between 0 to 1.
Click on the button Normalize and choose the best option for you.
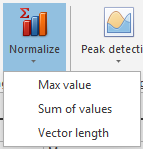
The available options are:
-
Max value: The highest peak will become 1. Note that when there is 1 incorrect high value it will impact all others, so this methods is very sensitive for that.
-
Sum of values: The sum of the values is 1. The number of values should be similar between spectra. Because a spectrum with 1.000 values is very different from a spectrum with 20.000 values.
-
Vector length: Each point is 1 dimension. Take the sum of the square of all the values and take the root then you have the length in 20.000 dimensions of that vector. That calculated value will be set to 1.
The Vector length is the best mathematical method to use and therefore recommended.