

Peak detection
The next step is the peak detection. Note that the peak detection can be started without the normalization step being performed.
The peak detection detects peaks automatically and generates a new spectrum. In the Options the peak minimum radius and the peak minimum are ratio can be set.
Click on the button Peak detection and choose the best option for you.
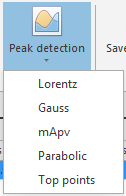
The available options are:
-
Lorentz
-
Gauss
-
mApv
-
Parabolic
-
Top points
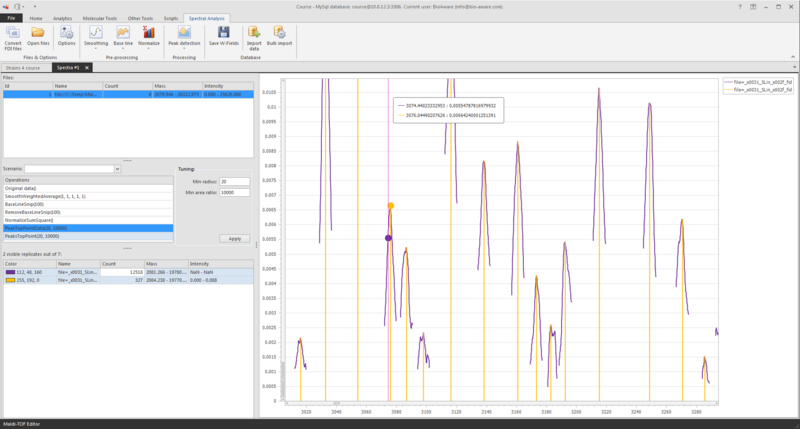
The Top points method takes the top of the peaks. The curves are separated from each other, each curve is a given surface/area calculated with 10 points left and 10 points right from the peak (because the radius is 20). If the surface is too small then the curve will be ignored.
The Gauss methods is more curve fitting because it makes more computations.
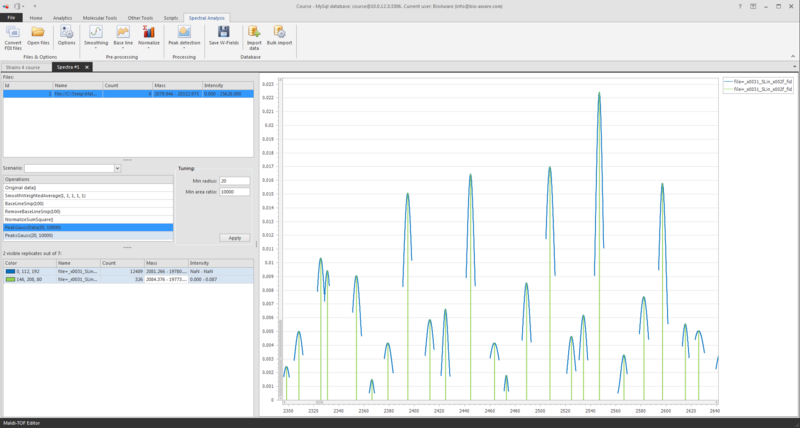
When you add the normalized line (red line in picture below) in that same graph as shown above then you see that the curve fitting is much better than when taking the top of all the small sub-peaks.
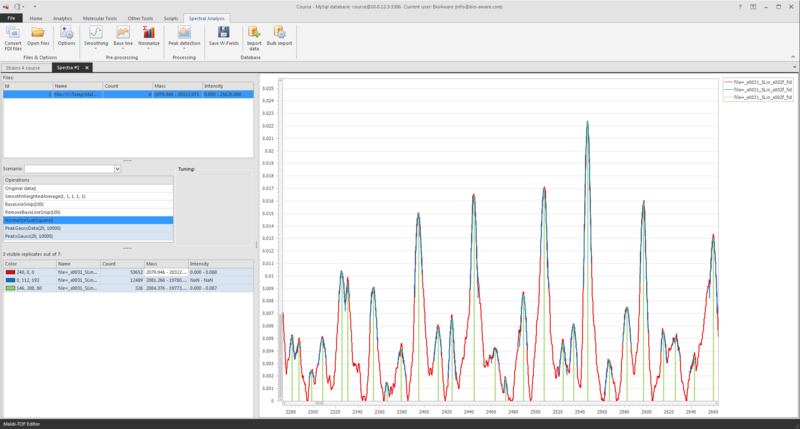
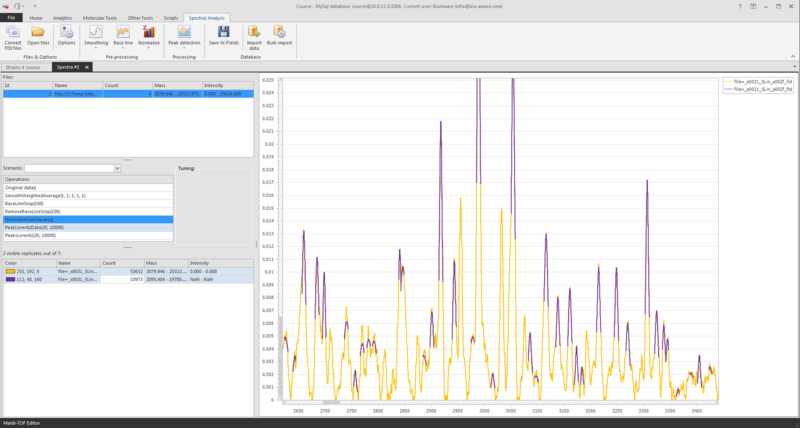
The Lorentz method is used in the picture below and the normalized line (yellow) is shown together with the peak detection line (blue)
It is up to you to decide what is the ‘best’ method to use. It depends on the data you use, and note that there is not a fixed method which is by default better than the others.