Graphic viewer
-
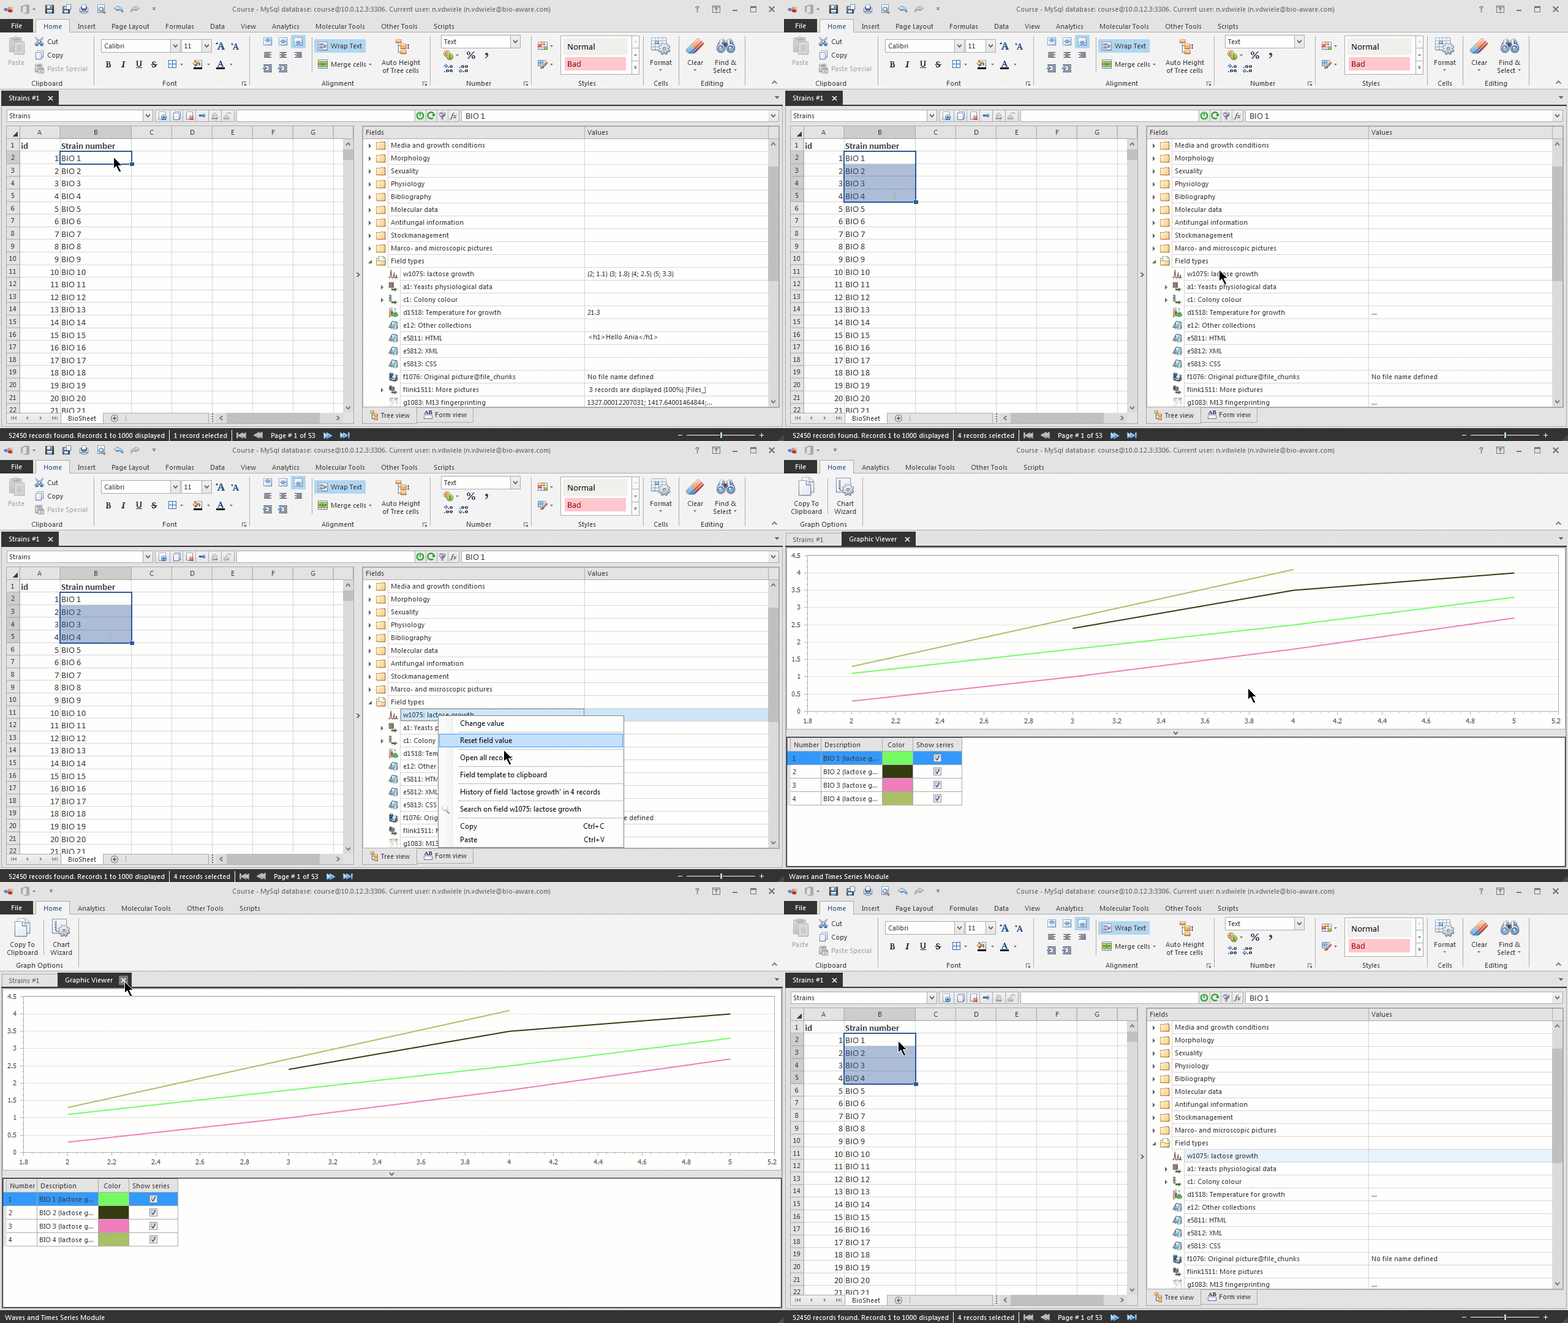
There are two ways to open the graphic viewer:
-
Double-click on a W field in the tree in the main window of BioloMICS, and click Show in graph
 .
. -
Double-click on the W field in the tree in the main window of BioloMICS. Select multiple records in the grid to add more data to the same graph.
 For the WLink field, press the Ctrl-key and select the linked records that should be included in the graph. Right-click and choose Open.
-
To save the image of the graph, click the Copy To Clipboard button in the ribbon.
-
To change the type of chart, click the Chart wizard button in the ribbon.


